All documentation links
ProActive Workflows & Scheduling (PWS)
-
PWS User Guide
(Workflows, Workload automation, Jobs, Tasks, Catalog, Resource Management, Big Data/ETL, …) PWS Modules
Job Planner
(Time-based Scheduling)Event Orchestration
(Event-based Scheduling)Service Automation
(PaaS On-Demand, Service deployment and management)
PWS Admin Guide
(Installation, Infrastructure & Nodes setup, Agents,…)
ProActive AI Orchestration (PAIO)
PAIO User Guide
(a complete Data Science and Machine Learning platform, with Studio & MLOps)
1. Main concepts of PEO
ProActive Event Orchestration (PEO) monitors a system to detect complex events, and triggers actions when activated rules are fired.
PEO is configured with rules to define the metrics to monitor, actions to be performed, and conditions to be met to trigger them.
ProActive Event Orchestration is organized as a Catalog of rules (which can be activated or deactivated) that will automatically trigger user-specified actions if defined conditions are fulfilled.
For example, PEO is able to monitor some computing resources (ProActive Nodes) and deploy new resources (scale up) when the monitored resources are overloaded. Another use case is to notify users with alerts about some deteriorated resources.
In general PEO allows to trigger any action by submitting a workflow to the ProActive Scheduler.
Definitions:
- Rule
-
- defines a monitoring behavior, triggering actions according to some predefined conditions. Rules generally use a template for certain monitoring use cases, configurable using specific variables.
- Rule Instance
-
- instantiated rule with concrete set of variables. One rule can have several rule Instances with different variable values. The rule instance can be activated/deactivated. Proactive Event Orchestration service will monitor metrics defined inside the rule only for activated instances.
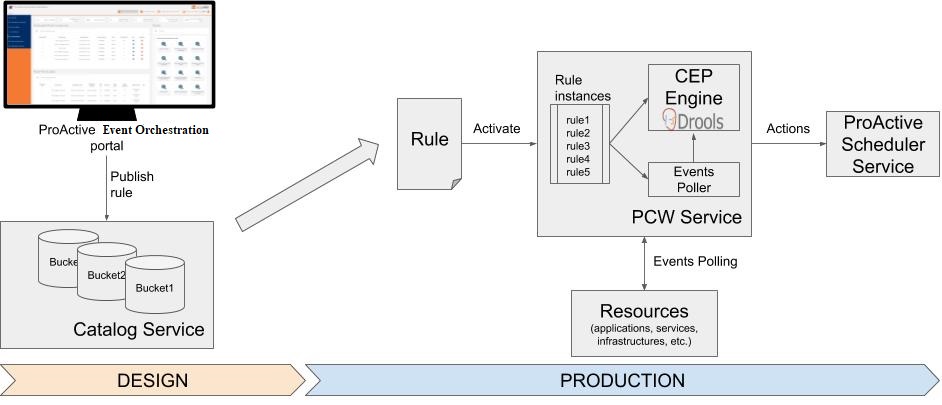
The diagram above illustrates the general overview of PEO functionality.
1.1. Monitoring
There are several types of metrics that can be monitored by PEO. ProActive Event Orchestration implements a polling mechanism to collect the monitoring metrics. A delay can also be added to resume monitoring after an action has been triggered only after a certain time. This feature is very useful in case of scale up/down use cases and helps to avoid triggering extra actions until the new resource is deployed/undeployed.
The design of PEO allows to add new types of monitoring metrics.
1.1.1. Monitoring physical metrics
ProActive provides a way to monitor system metrics of virtual and physical machines (Nodes) deployed by ProActive Resource Manager.
Thanks to the JMX protocol, ProActive Nodes can expose many system metrics from the underlying operating system (disk, RAM, CPU usage, network activity, etc…).
ProActive Nodes use the Sigar library to collect physical metrics.
ProActive Event Orchesration can monitor any ProActive Node with JMX URL to access the following metrics:
-
System memory, swap, CPU, load average, uptime, logins.
-
Per-process memory, CPU, credential info, state, arguments, environment, open files.
-
File system threshold detection and metrics.
-
Network interface detection, configuration information and metrics.
-
Network route and connection tables.
1.1.2. Monitoring host accessibility
Another type of monitoring available in PEO is to check host accessibility. The implementation of this metric follows the ping host approach. With the help of this metric a user can easily check if a host is up or down and automatically trigger an action.
1.2. Processing mechanism
The core of rule processing is managed by the Drools Engine for performance processing of collected metrics. It features powerful mechanisms for complex event processing. The advanced Drools algorithm helps fast detection of fulfilling the conditions and triggering actions.
1.3. Rule’s action
According to the concepts of PEO, the action will be triggered when specified condition is met.
In order to make an action flexible to any user needs, the rule’s action is firing a job inside scheduler. A user just need to specify which workflow from Catalog will be fired as rule’s action.
For example, one can design an action workflow that sends a notification (alert) whenever a metric reaches a critical value.
For scalability use cases, Service Automation can be started as a rule’s action that will deploy the new resources.
2. PEO portal - Using existing rules
In the Automation Dashboard portal, the Event Orchestration view allows users to activate and parametrize a predefined set of rules and also to create new ones.
The next screenshot illustrates PEO portal.
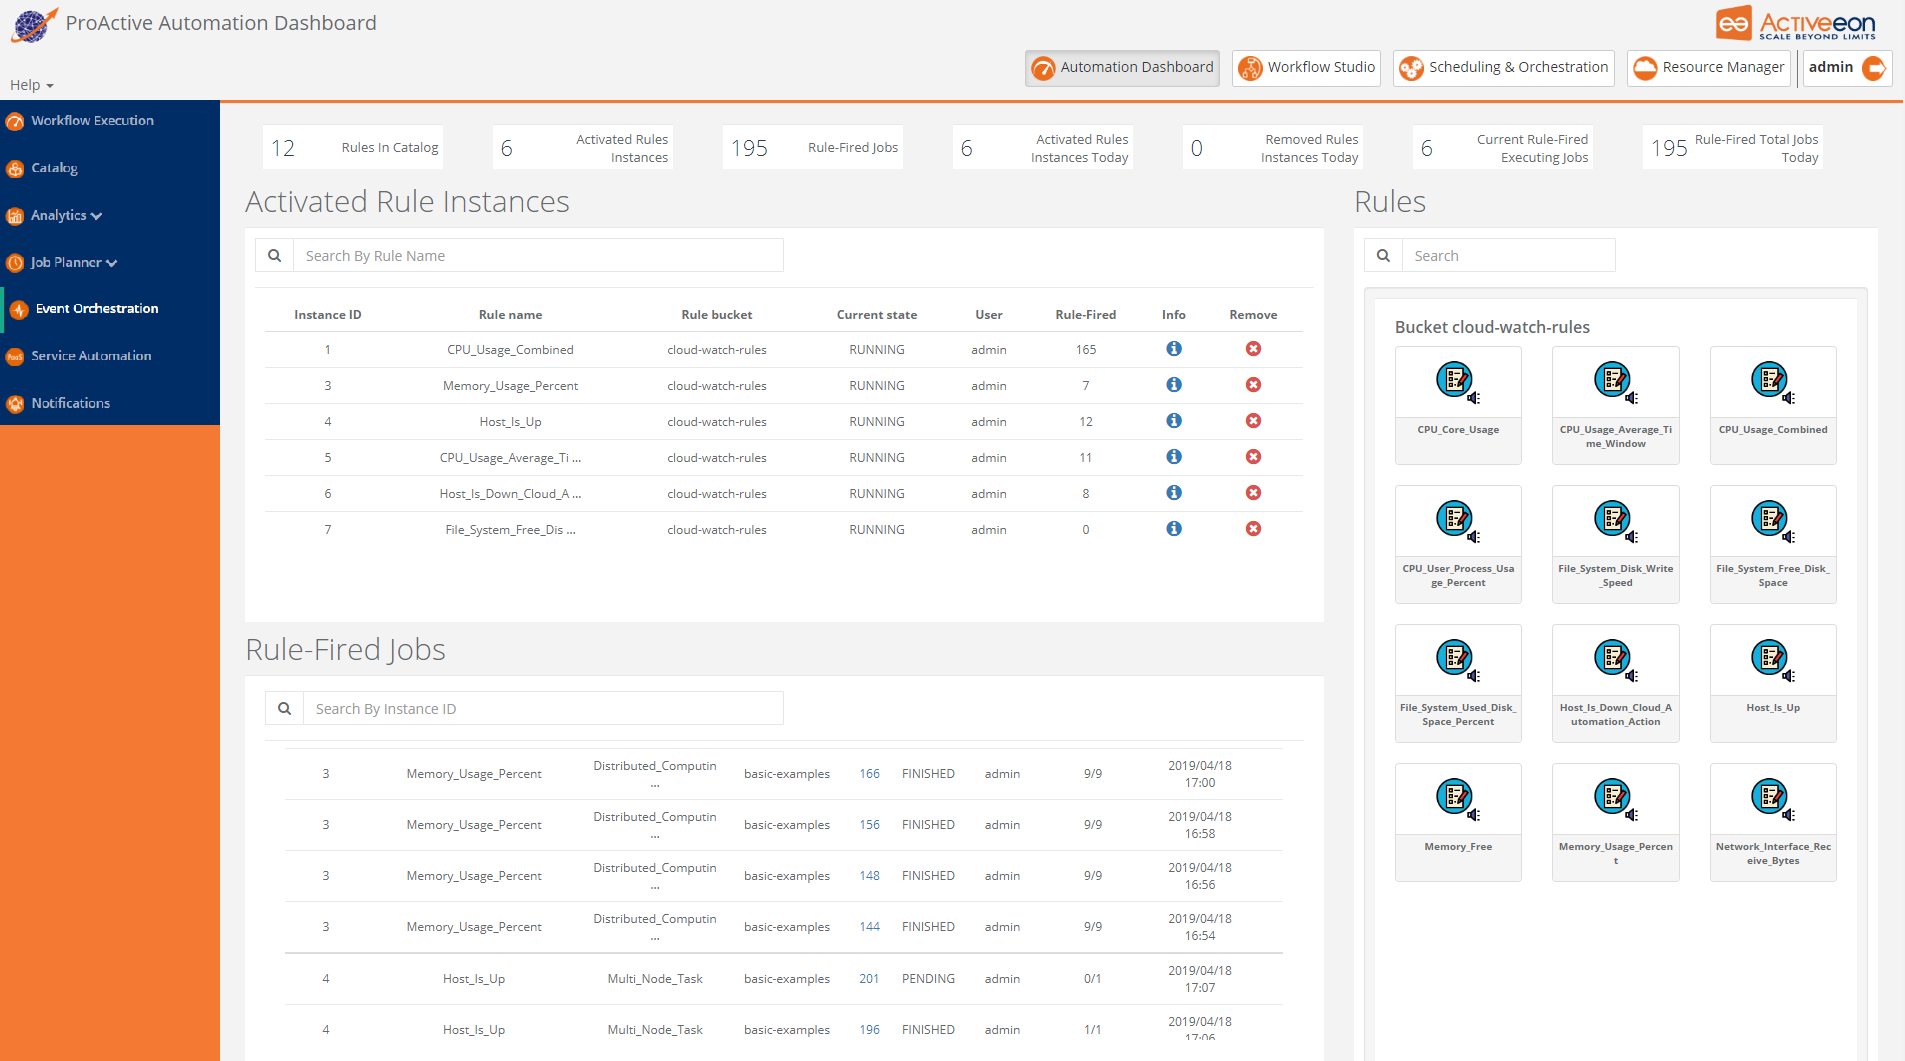
The portal is divided into several sections:
-
In the
Rulespanel a user can find the set of predefined PEO rules ready to be activated. -
Activated Rule Instancespanel shows all rule instances after being activated with certain variables. -
Rule - Fired Jobstable provides information about triggered jobs inside Scheduling as actions of activated rules. -
Removed Rule Instancespanel gives the list of all rule instances that were removed from the list of activated rules.
In order to better understand the usage of PEO portal, let’s take an example of using existing PEO rules provided by the ProActive distribution.
2.1. Activating a rule
Here is an example that illustrates a simple use case of PEO portal.
The next screenshot shows how to activate a rule, when a user selects a certain rule from the list of Rules.
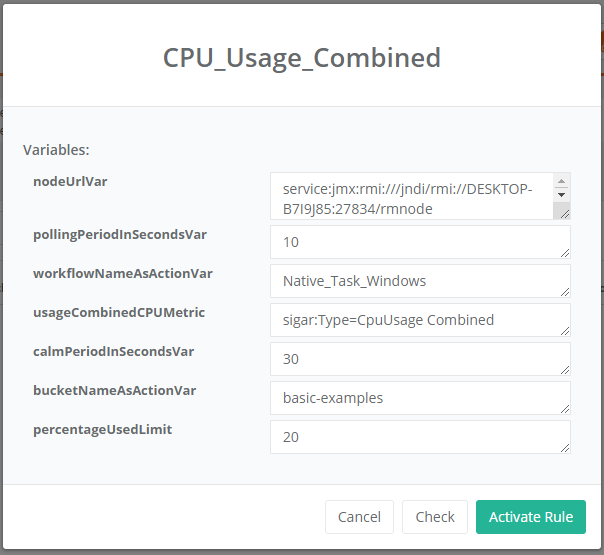
A user can change the default values.
A user should Obtain a JMX node url and paste it in the nodeUrlVar variable.
After modifying the variables a user can Check (validate) the rule or directly Activate it.
2.2. Using rule variables
The rule variables depend on the definition and purpose of the rule. There are different variables for different rules. The designer of a new rule can choose the set of needed variables.
Let’s give explanation of rules for our example:
-
nodeUrlVar - URL of the JMX endpoint what will be monitored
-
pollingPeriodInSecondsVar - time frequency when collecting metrics from monitored resource
-
calmPeriodInSecondsVar - time period during which the metrics are not collected after the rule action was triggered
-
workflowNameAsActionVar - name of the workflow inside ProActive Catalog that will be fired as action
-
bucketNameAsActionVar - name of the Catalog bucket identifying the workflow that will be fired as action
-
usageCombinedCPUMetric - specific Sigar metric for this rule, identifying combined CPU usage kpi
-
percentageUsedLimit - threshold of CPU consumption (in percentage) which will trigger the action. This variable is directly connected to the rule condition.
2.3. Activated rule instances
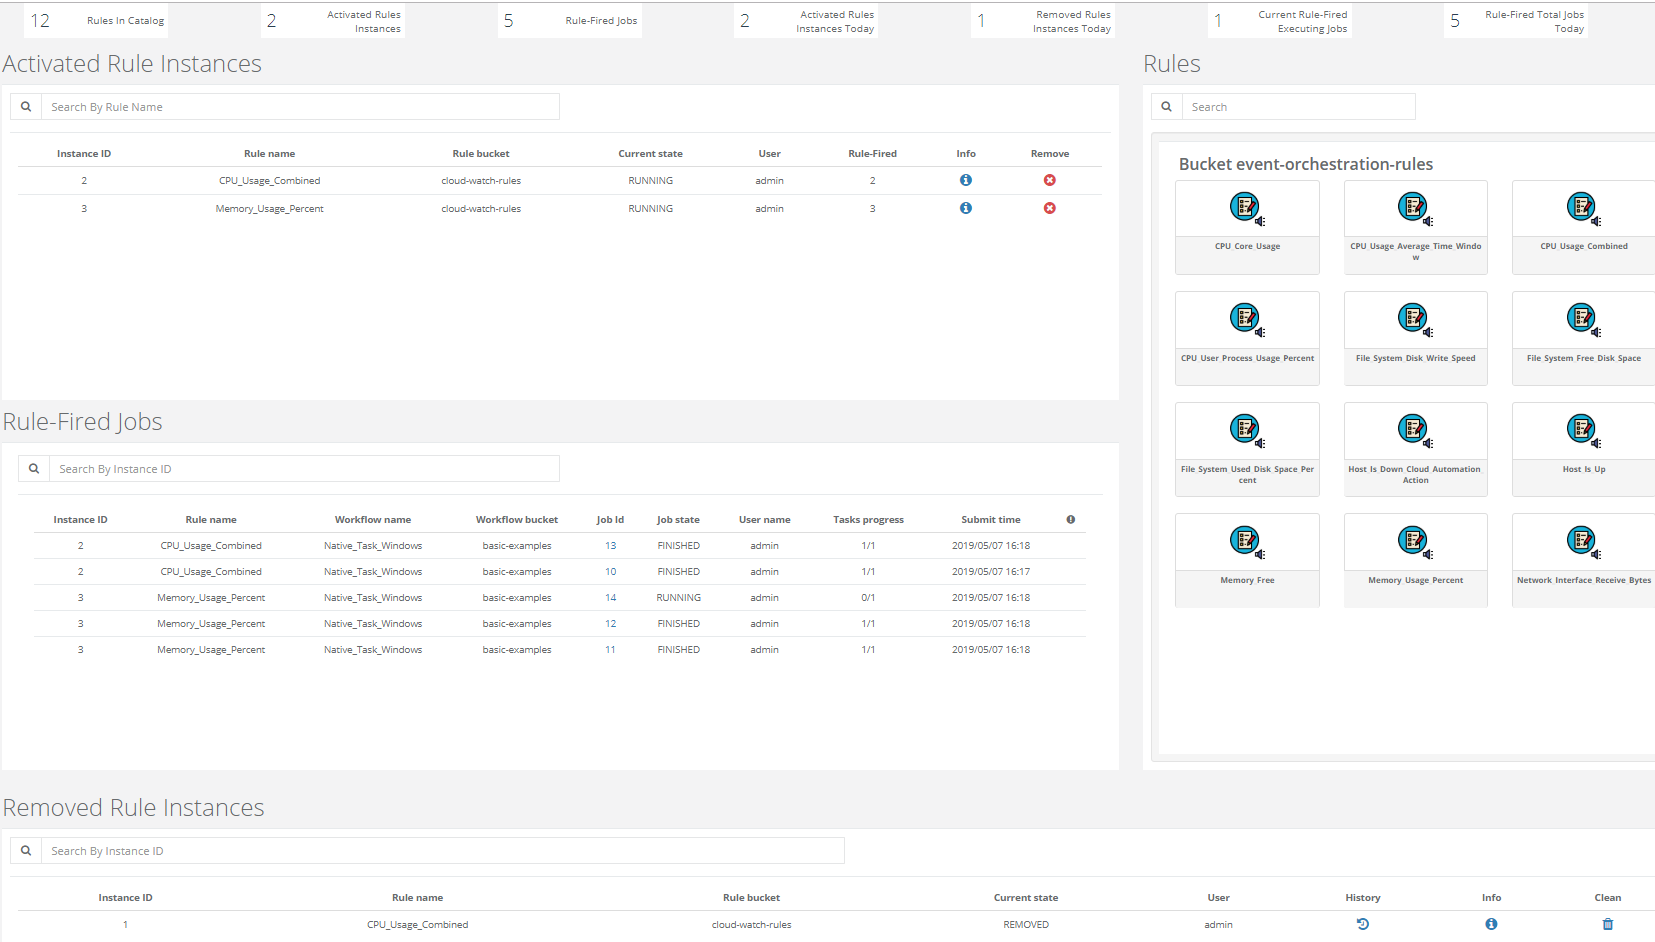
After activation of a rule, the instance will appear in section Activated Rule Instances.
All the activated rule instances are monitoring the specified resources. If the triggering condition is met, then the rule will fire the job. This fired job description will appear in Rule - Fired Jobs table. The monitoring and triggering actions can be stopped by removing an Activated rule instance. After removing a rule instance from active list, it will appear in the Removed Rule Instances table. It is possible to see the history of all fired jobs for this table.
This behaviour is demonstrated in the next screenshot.
2.4. Obtaining JMX node URLs
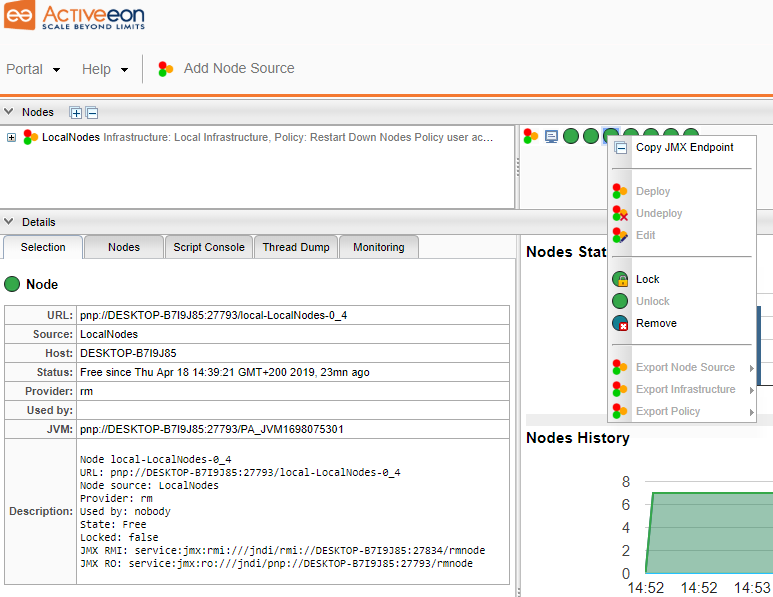
ProActive Resource Manager portal provides access to monitoring capabilities. During the activation of a rule, a user should enter as rule parameter a JMX endpoint corresponding to the monitored resource (for example a ProActive Node).
In order to get this information from a Node, a user can go to the RM portal, click on the right button of a Node which should be monitored and click Copy JMX Endpoint. Then, he can come back to Event Orchestration portal and paste the JMX URL in the corresponding field.
3. Create new Event Orchestration rules
ProActive Event Orchestration portal allows to customize the predefined Catalog of rules and also to create new rules from scratch.
The provided rules in ProActive Catalog are a good starting point to design more complex scenarios.
3.1. Rule’s structure explanation
The rule definition consists of the following main parts:
-
Variables definition. A user can add variables according to its needs. All variables will be replaced with their values inside the rule implementation using the following pattern: #variableName
-
Definition of polling metrics. Polling metrics are specific parameters which depends on the polling class implementation. Polling parameters can reuse the rule variables. The collecting metrics are usually the physical metrics explained in the section Monitoring physical metrics provided by JMX endpoint, like CPU, Memory, etc.
-
Definition of Drool’s rule. In this part we use Drools standardized language to describe a triggering condition and an action.
<?xml version="1.0" encoding="UTF-8"?>
<rule xmlns="urn:proactive:ruledescriptor:1.0" xmlns:xsi="http://www.w3.org/2001/XMLSchema-instance"
      xsi:schemaLocation="urn:proactive:ruledescriptor:1.0 https://www.activeeon.com/public_content/schemas/proactive/ruledescriptor/1.0/ruleschema.xsd">

    <variables>
        <variable name="nodeUrlVar" value="service:jmx:rmi:///jndi/rmi://tryqa.activeeon.com:59885/rmnode" />
        <variable name="percentageUsedLimit" value="90" />
        <variable name="bucketNameAsActionVar" value="basic-examples" />
        <variable name="workflowNameAsActionVar" value="Native_Task_Linux" />
        <variable name="pollingPeriodInSecondsVar" value="60" />
        <variable name="calmPeriodInSecondsVar" value="120" />
        <variable name="usageCombinedCPUMetric" value="sigar:Type=CpuUsage Combined" />
    </variables>

    <ruleImplementation>
        <pollingClass value="Jmx_Metrics">
            <parameters>
                <parameter name="jmxCredentialsFile" value="#pathToCredentialFileVar" />
                <parameter name="nodeUrl" value="#nodeUrlVar" />
                <parameter name="pollingPeriodInSeconds" value="#pollingPeriodInSecondsVar" />
                <parameter name="calmPeriodInSeconds" value="#calmPeriodInSecondsVar" />
            </parameters>
        </pollingClass>
        <kpis>
            <kpi>#usageCombinedCPUMetric</kpi>
        </kpis>
        <droolContent>
        <![CDATA[
package org.ow2.proactive.cloud_watch.rules
import java.util.*;
import  org.ow2.proactive.cloud_watch.model.*;
import  org.ow2.proactive.cloud_watch.service.*;
global org.ow2.proactive.cloud_watch.action.ActionExecutorFromCatalog executorWorkflowFromCatalog;
declare isNodeAction
 nodeMetrics: NodeMetrics
end

rule #autogenerated_rule_id
when
    exists  kpi : NodeMetrics( url == "#nodeUrlVar" )
    $metric: NodeMetrics(metrics["#usageCombinedCPUMetric"] * 100  > #percentageUsedLimit)

then
    Map<String, String> parameters = new HashMap();
    parameters.put("credentialsPath","#pathToCredentialFileVar");
    executorWorkflowFromCatalog.submitToScheduler(parameters, "#autogenerated_rule_id", "{'bucket_name':'#bucketNameAsActionVar','workflow_name':'#workflowNameAsActionVar','variables':{}}");
end
]]>
        </droolContent>
    </ruleImplementation>
</rule>
You can see above an example of portable rule in xml format that can be saved in ProActive Catalog.
3.2. Rule’s variables definition
The above provided example describes a rule for monitoring CPU usage. The aim of this rule is to monitor the CPU usage and trigger an action when the threshold is reached.
 <variables>
    <variable name="nodeUrlVar" value="service:jmx:rmi:///jndi/rmi://tryqa.activeeon.com:59885/rmnode" />
    <variable name="percentageUsedLimit" value="90" />
    <variable name="bucketNameAsActionVar" value="basic-examples" />
    <variable name="workflowNameAsActionVar" value="Native_Task_Linux" />
    <variable name="pollingPeriodInSecondsVar" value="60" />
    <variable name="calmPeriodInSecondsVar" value="120" />
    <variable name="usageCombinedCPUMetric" value="sigar:Type=CpuUsage Combined" />
 </variables>
A user can define his own set of rule variables as it has a simple key-value structure.
3.3. Monitoring part
As explained in the document section Monitoring, Proactive Event Orchestration service can monitor 2 types of metrics: Monitoring physical metrics and Monitoring host accessibility. Each monitoring type has an implementation of a Polling class. The polling parameters depends on the chosen implementation of a Polling class. We will provide below examples of polling parameters for each monitoring type.
3.3.1. Polling parameters for Monitoring physical metrics
<ruleImplementation>
    <pollingClass value="Jmx_Metrics">
        <parameters>
            <parameter name="jmxCredentialsFile" value="#pathToCredentialFileVar" />
            <parameter name="nodeUrl" value="#nodeUrlVar" />
            <parameter name="pollingPeriodInSeconds" value="#pollingPeriodInSecondsVar" />
            <parameter name="calmPeriodInSeconds" value="#calmPeriodInSecondsVar" />
        </parameters>
    </pollingClass>
    <kpis>
        <kpi>#usageCombinedCPUMetric</kpi>
    </kpis>
The code above describes a polling configuration for Monitoring physical metrics. This particular example is for monitoring CPUs.
The polling and calm periods correspond to the frequency of collecting the monitoring metrics. The concrete set of parameters relies on the implementation of a Polling class. In our example, the class is Jmx_Metrics. This implementation takes two parameters: the JMX node URL and the JMX credentials.
The actual metric to monitor is represented by the <kpi> tag. Several metrics can be monitored at the same time. For our example after variables replacement the monitoring metric will be "sigar:Type=CpuUsage Combined".
3.3.2. Polling parameters for Monitoring host accessibility
The other type of monitoring is checking the host accessibility. The example of the polling parameters for this case is shown next:
<ruleImplementation>
    <pollingClass value="Ping">
        <parameters>
            <parameter name="nodeUrl" value="google.com" />
            <parameter name="pollingPeriodInSeconds" value="60" />
            <parameter name="calmPeriodInSeconds" value="120" />
        </parameters>
    </pollingClass>
    <kpis> <kpi>upAndRunning</kpi> </kpis>
The polling class name for monitoring host accessibility is Ping. The nodeUrl parameter’s value defines the hostname or IP that should be monitored. The polling and calm periods specify the frequency of checking the provided hostname.
3.4. Rule’s condition and action
As said in Rule’s action section, we will specify rule’s condition and action in Drools language.
The possible actions are:
-
submit workflow to ProActive Scheduler
-
start ProActive Service Automation.
Both examples are provided below.
3.4.1. Submit to ProActive Scheduler as rule’s action
The described condition and action follows an example of CPU monitoring. The job will be submitted to ProActive Scheduler as a rule’s action.
<droolContent>
<![CDATA[
package org.ow2.proactive.cloud_watch.rules
import java.util.*;
import  org.ow2.proactive.cloud_watch.model.*;
import  org.ow2.proactive.cloud_watch.service.*;
global org.ow2.proactive.cloud_watch.action.ActionExecutorFromCatalog executorWorkflowFromCatalog;
declare isNodeAction
 nodeMetrics: NodeMetrics
end

rule #autogenerated_rule_id
when
    exists  kpi : NodeMetrics( url == "#nodeUrlVar" )
    $metric : NodeMetrics(metrics["#usageCombinedCPUMetric"] * 100  > #percentageUsedLimit)

then
    Map<String, String> parameters = new HashMap();
    parameters.put("credentialsPath","#pathToCredentialFileVar");
    executorWorkflowFromCatalog.submitToScheduler(parameters, "#autogenerated_rule_id", "{'bucket_name':'#bucketNameAsActionVar','workflow_name':'#workflowNameAsActionVar','variables':{}}");
end
]]>
</droolContent>
The next part uses pure Drools syntax for specifying a rule condition and an action. In the provided JMX CPU metric example a when part defines two conditions:
-
the metric should arrive from the specified node URL
-
CPU usage percentage should be bigger than the specified limit
The then part is an actual action triggered when a condition is met. In the example, a workflow stored in ProActive Catalog will be submitted to ProActive Scheduler.
3.4.2. Start ProActive Service Automation as rule’s action
This section will show the described condition and action of a host accessibility monitoring example. The ProActive Service Automation will be started as a rule’s action.
<droolContent>
<![CDATA[
package org.ow2.proactive.cloud_watch.rules
import java.util.*;
import  org.ow2.proactive.cloud_watch.model.*;
import  org.ow2.proactive.cloud_watch.service.*;
global org.ow2.proactive.cloud_watch.action.ActionExecutorFromCatalog executorWorkflowFromCatalog;
declare isNodeAction
 nodeMetrics: NodeMetrics
end

rule #autogenerated_rule_id when
    exists  kpi : NodeMetrics( url == "#hostAddressVar" )
    $metric : NodeMetrics(metrics["upAndRunning"]  == false)

then
    Map<String, String> parameters = new HashMap();
    parameters.put("credentialsPath","#pathToCredentialFileVar");
    executorWorkflowFromCatalog.submitToCloudAutomation(parameters, "#autogenerated_rule_id", "{'bucket_name':'#bucketNameAsActionVar','workflow_name':'#workflowNameAsActionVar','variables':{}}");
end
]]>
</droolContent>
The provided host accessibility example will trigger an action when the specified host is down. This triggering behavior is declared in when part with 2 conditions:
-
the monitoring URL should be equal to specified host address
-
upAndRunning metric should be false (the host is not accessible in this case)
In then part of provided example you can observe how to start Service Automation as rule’s action.
Using standard Drools language for description of the condition gives a big advantage. It allows to specify complex use cases and benefit from Drools Engine processing.
With ProActive distribution there are provided examples for monitoring with slicing time window, for example: monitoring an average of memory usage for last 30 seconds. In the Drools language, we can specify such condition with slicing time window and triggering action.
Even if the design of the xml rule looks complex, choosing Drools syntax gives a huge flexibility to express user requirements.
3.5. Display a created rule in Event Orchestration portal
Once the rule is defined, it should be saved in Catalog with the specific kind Rule. Please check out the Catalog documentation section for more information about saving objects in Catalog.
Legal notice
Activeeon SAS, © 2007-2019. All Rights Reserved.
For more information, please contact contact@activeeon.com.